How much do nursing homes spend on pharmacy? Nobody publishes a reliable national answer. The most-cited public figure is one operator's report of about $40 to $48 per Medicare Part A resident-day for 2017 and 2018, and no federal dataset breaks out what each facility pays its pharmacy. The only number you can trust is your own, calculated from your invoices and your census.
Why is there no national number for nursing home pharmacy spend?
Three reasons, and each one is structural.
First, the payer changes the bill. During a covered Medicare Part A stay, drugs are inside the facility's daily rate under consolidated billing (42 CFR 411.15(p)). For a long-stay Medicaid or private-pay resident, the pharmacy usually bills Part D, Medicaid or the resident directly. So "pharmacy spend" for a nursing home mostly means facility-paid drug spend: drugs the facility owes for because of the resident's payer that day. That share depends on each building's payer mix, which varies widely.
Second, Medicare pays a bundle. The Part A per diem covers routine, ancillary and capital costs together. Medicare claims show days and payment, not a drug line. The Patient Driven Payment Model (PDPM), Medicare's SNF case-mix system, does have a non-therapy ancillary (NTA) component that reflects drug and other ancillary costs, but it is a payment, not a record of what anyone spent (CMS PDPM).
Third, the cost report is not built for it. The Medicare cost report does have drug cost centers. Under Form CMS-2540-24, line 11 (Pharmacy) holds routine drugs and pharmacy costs, while line 41 (Drugs Charged to Patients) and line 42 (IV Solutions) hold drugs traced to individual residents (CMS Provider Reimbursement Manual, Part 2, Chapter 49). But those lines are all-payer, classification varies by preparer, and the public use file most people download does not include them. The CMS Skilled Nursing Facility Cost Report file reports days, beds, total costs and balance sheet items. It has no drug cost column.
What public data exists on nursing home drug costs?
Here is what is actually available, and what each source can and cannot tell you.
| Source | What it tells you | What it does not tell you |
|---|---|---|
| MedPAC, March 2026 Report to the Congress, Ch. 7 | Fee-for-service Medicare spent $26 billion on SNF care in 2024. Ancillary cost per day, which includes therapy, grew 1% in 2024 | Drug cost as a separate figure |
| CMS SNF cost report (Form CMS-2540-24) | Pharmacy and drug cost centers exist on Worksheet A | A clean, comparable drug number in the public use file |
| CMS PDPM, NTA component | Drug-heavy conditions raise the NTA payment, front-loaded at 3.0 times on days 1 to 3 (CMS fact sheet) | What the facility actually paid |
| CMS Post-Acute Care public use file | Original Medicare Part A days by facility (data.cms.gov) | Medicare Advantage days or any cost |
| One operator in Becker's Hospital Review | Medication cost of about $40 per patient-day in 2017 and $48 in 2018 | Whether that is typical. It is one operator, eight years ago |
| HHS OIG audit A-09-21-03008 | Part D paid up to $465.1 million, 2018 to 2020, for drugs Part A should have covered | What facilities spend. It measures misbilling, not spend |
That is the honest state of the evidence. A denominator from CMS, a payment model that confirms drugs drive cost early in a stay, and a single operator-reported price point.
What could your building recover?
Two numbers, instant estimate. No email needed.
What does the public data add up to?
We built one estimate from these pieces for New York, and we label it as an estimate. The Part A Pharmacy Report multiplies New York's 4,608,073 Original Medicare Part A days in fiscal year 2024 (public data, CMS Post-Acute Care file) by $40 to $48 a day. The result is $184M to $221M a year in facility-paid Part A drug spend across the state. Pennywell estimate.
For one building, the same method gives the median New York facility, with 4,895 Part A days, roughly $196k to $235k a year. A facility at the 75th percentile is above $524k. Pennywell estimate. The details are in our article on New York nursing home pharmacy costs.
Three things would push the true figure up: Medicare Advantage days where the plan's per diem includes drugs, drug price growth since 2018, and higher-acuity residents. One thing would push it down: buildings with lower drug intensity than the operator in the source. The estimate is a starting point for a conversation, not a benchmark.
Why do owners care about a number nobody publishes?
Because the money comes straight out of margin. MedPAC reports that the all-payer total margin for freestanding SNFs was 2.1% in 2024, while the fee-for-service Medicare margin was 24%. Medicare covered days were just 8% of facility days at the median facility. Part A residents are the most profitable days in the building, and drugs are one of the few costs on those days that the facility does not control clinically but can check financially.
A pharmacy invoice that is a few percent too high on facility-paid lines is a real share of a 2% total margin. That is why the useful question is not "what do other homes spend" but "is what we paid correct."
How do you calculate your own pharmacy spend?
The formula is simple: facility-paid drug spend ÷ facility-responsible resident-days. A facility-responsible resident-day is a day on which the facility, not Part D or Medicaid, owes for the resident's drugs. That is mainly covered Part A days, plus managed care days where the contract puts drugs inside the per diem. Our step-by-step guide to Part A drug cost per patient day walks through a worked example.
- Pull 12 months of pharmacy invoices with line detail. Keep only lines billed to the facility.
- Add credits in the month the drug was dispensed, not the month the credit posted, so returns do not distort a single month.
- Separate excluded drugs. Drugs on the consolidated billing exclusion lists are billed outside the Part A rate, so they should not be in your facility-paid total. See SNF consolidated billing exclusions.
- Count facility-responsible days from your census. Use Part A days, plus Medicare Advantage days where drugs sit inside the per diem. Your cost report's Worksheet S-3, Part I reports SNF fee-for-service and HMO days separately.
- Divide. Then split the answer by payer, because Part A and managed care rarely run at the same cost per day.
- Check the lines, not just the total. A low number can hide drugs the pharmacy billed to Part D during a Part A stay. That is an exposure, not a saving, and it is what the OIG is reviewing.
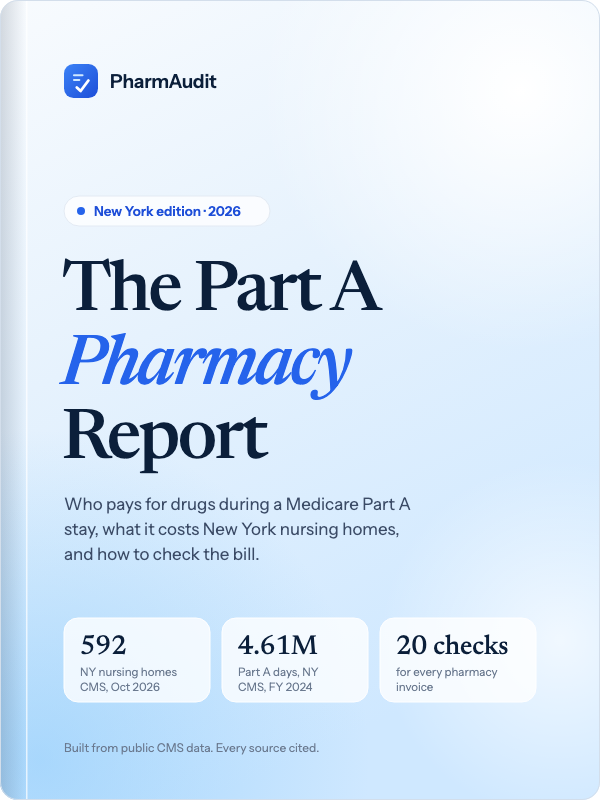 Free report · New York editionThe Part A Pharmacy Report 202620 pages built from public CMS data: Part A days, drug cost estimates, the 20-point invoice checklist.Get the report
How should you use a benchmark once you have one?
Use your own trend first. Twelve months of cost per facility-responsible day, by month, will show whether a contract change, a new admission source or a billing error moved the number. A building that runs at $38 one quarter and $52 the next has a question to answer, whatever any outside figure says.
Then compare across your own buildings. A regional operator with five homes on the same pharmacy contract has a better benchmark in its own portfolio than anything published. Differences between buildings on the same contract usually come from census accuracy, credits and fees, which you can check with a pharmacy invoice audit.
Treat outside numbers as a range to test, not a target. The $40 to $48 figure is useful because it is public and sourced. It is not a standard, and a building far from it is not wrong for that reason alone.
Free · 48 hours · no integration
Get a free 48-hour pharmacy audit
- Send three files: invoices, census, contract
- See overbilling and Part A exposure, line by line
- BAA signed before any data moves
Frequently asked questions
What is the average pharmacy cost per resident-day in a nursing home?
No reliable national average exists. The most-cited public figure is one operator's report of about $40 to $48 per patient-day for 2017 and 2018, published in Becker's Hospital Review. It is one data point, not a benchmark, and drug prices have changed since.
Does the Medicare cost report show what a nursing home spends on drugs?
Partly. Form CMS-2540-24 has a Pharmacy cost center (line 11) and Drugs Charged to Patients and IV Solutions cost centers (lines 41 and 42). These are all-payer figures, preparers classify costs differently, and the public use file on data.cms.gov does not include them.
Who pays for a long-stay Medicaid resident's drugs?
Usually not the facility. For most long-stay residents, the pharmacy bills Part D, Medicaid or the resident. The facility's own drug cost comes mainly from covered Part A days and from managed care contracts that include drugs in the per diem.
Is lower pharmacy spend always better?
No. A low facility-paid total can mean the pharmacy is billing Part D for drugs during Part A stays. The OIG estimated Part D paid up to $465.1 million for such drugs from 2018 to 2020. Lower spend is good only if the lines are correct.
Get the 48-hour first look
Send three months of pharmacy invoices, your census and your pharmacy services agreement. Within 48 hours we show your facility-paid drug cost per resident-day, where the invoice does not match the census, and what it is worth. Start with the free 48-hour audit or the savings calculator.