New York nursing home pharmacy costs for Medicare Part A residents are large and mostly invisible in public data. Original Medicare paid New York nursing homes for 4.61 million Part A days in fiscal year 2024, and on each of those days the facility, not Part D, owed for the resident's drugs. At $40 to $48 a day, that is an estimated $184M to $221M a year in facility-paid Part A drugs, or roughly $196k to $235k for the median building (Pennywell estimate).
How big is the New York nursing home market?
The figures below come from our Part A Pharmacy Report, New York edition, built only from public CMS files. Each number carries a label: public data when it comes straight from a source, Pennywell estimate when we calculated it with an assumption.
| Measure | New York | Label | Source |
|---|---|---|---|
| Nursing homes | 592 | Public data | CMS Provider Information, October 2026 release |
| Certified beds | 111,253 (median 160 per building) | Public data | Same |
| Average occupancy | 88.9% | Public data | Same |
| Original Medicare Part A days, FY 2024 | 4,608,073 | Public data | CMS Post-Acute Care file |
| Part A stays, FY 2024 | 131,576 (about 35 days per stay) | Public data | Same |
| Medicare payment for those days | $3.23 billion (about $702 per day) | Public data | Same |
| Share of national Part A days | 10.3% | Public data | Same |
| Facility-paid Part A drug spend | $184M to $221M a year | Pennywell estimate | Days × $40 to $48 |
New York buildings are large. The average has about 188 beds. The Medicare Part A counts come from the CMS Medicare Post-Acute Care Utilization file, which covers Original Medicare only. Medicare Advantage stays are not in it.
Why do Part A days drive pharmacy cost in New York?
During a covered Medicare Part A stay, drugs are inside the facility's daily rate under consolidated billing (42 CFR 411.15(p)). The pharmacy should bill the facility, not Part D, not Medicaid and not the family. For most long-stay residents, the pharmacy bills Part D or Medicaid directly.
So the facility's own drug cost follows its Part A days. In New York, Medicare was 13.8% of resident-days reported on 2023 cost reports, Medicaid 63.7% and other payers 22.5% (public data, 559 cost reports in the CMS SNF Cost Report file). About one resident-day in seven is a Medicare day. That small share carries most of the facility's drug cost risk, because it is the share the facility pays for directly and because short stays create the most admissions, discharges and payer changes. Our article on who pays for drugs during a Part A stay explains the rules.
What could your building recover?
Two numbers, instant estimate. No email needed.
Where are New York's Part A days?
Mostly downstate. New York City and Long Island hold 67% of the state's matched Part A days, and New York City alone 42% (public data, 573 of 592 facilities matched to the CMS file).
| Region | Facilities | Part A days, FY 2024 | Est. Part A drug spend |
|---|---|---|---|
| New York City | 167 | 1,948,964 | $78.0M–$93.6M |
| Long Island | 77 | 1,134,328 | $45.4M–$54.4M |
| Mid-Hudson | 85 | 679,161 | $27.2M–$32.6M |
| Capital Region | 40 | 148,440 | $5.9M–$7.1M |
| Western New York | 56 | 144,558 | $5.8M–$6.9M |
| Central New York | 28 | 127,439 | $5.1M–$6.1M |
| Finger Lakes | 56 | 117,463 | $4.7M–$5.6M |
| Mohawk Valley | 32 | 115,728 | $4.6M–$5.6M |
| Southern Tier | 34 | 105,580 | $4.2M–$5.1M |
| North Country | 17 | 65,598 | $2.6M–$3.1M |
Facilities and days are public data. The spend column is a Pennywell estimate: Part A days × $40 to $48.
At the building level, the median New York facility had 4,895 Part A days, about 13 Part A residents on an average day. The middle half ran from 2,620 to 10,916 days (public data).
What do Part A drugs cost a New York facility?
No public dataset reports what each nursing home pays its pharmacy for Part A residents. So we estimate it, and show the inputs.
The only public per-day figure we know of is one operator's report of about $40 a patient-day in 2017 and $48 in 2018, published in Becker's Hospital Review. It is one operator, not a benchmark, and it is not adjusted for inflation.
| New York facility | Part A days | Part A residents, avg. day | Drug spend (est.) |
|---|---|---|---|
| 25th percentile | 2,620 | 7 | $105k–$126k |
| Median | 4,895 | 13 | $196k–$235k |
| 75th percentile | 10,916 | 30 | $437k–$524k |
Part A days are public data. Drug spend is a Pennywell estimate. Statewide, the estimate equals 5.7% to 6.8% of Medicare's $3.23 billion in New York SNF payments.
What the estimate leaves out matters. Medicare Advantage days where the plan's per diem includes drugs would push it up. So would drug price growth since 2018 and residents on costly therapies. Buildings with lower drug intensity than the source operator would push it down. The full method, with a sensitivity table from $30 to $75 a day, is in the report. For the national picture, see how much nursing homes spend on pharmacy.
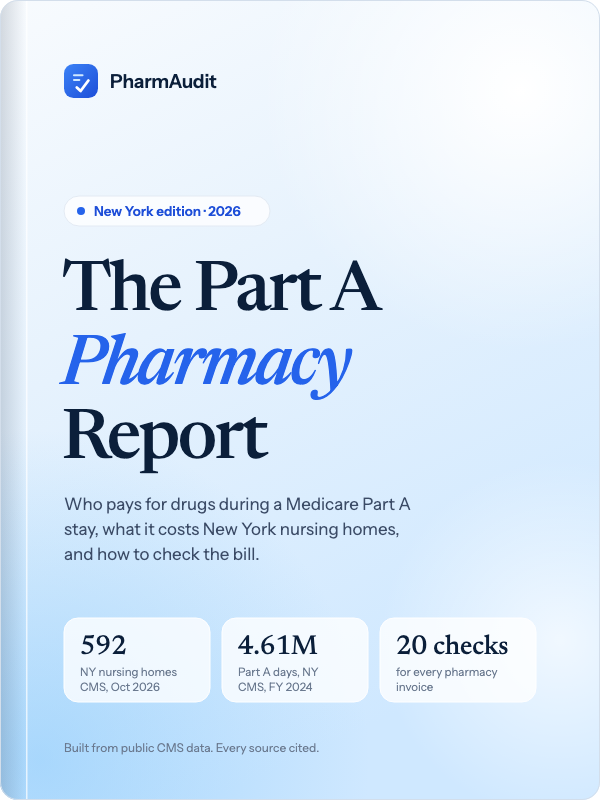 Free report · New York editionThe Part A Pharmacy Report 202620 pages built from public CMS data: Part A days, drug cost estimates, the 20-point invoice checklist.Get the report
Who runs New York nursing homes?
Of the 592 facilities, 409, or 69%, are run by operators with 15 or fewer buildings nationally, and 49.2% have no CMS chain affiliation at all (public data; operator grouping by Pennywell). By ownership, 70.3% are for-profit, 25.2% non-profit and 4.6% government.
Operator size matters for the pharmacy bill. Large chains can afford a contracts team, and some own their pharmacy. An independent nursing home or a regional operator usually relies on a business office that pays the invoice without time to match every line to the census.
Why is the OIG interested?
The HHS Office of Inspector General estimated that Part D paid up to $465.1 million from 2018 through 2020 for drugs that should have been covered under the Part A SNF benefit, nationally (OIG A-09-21-03008). In April 2025 it opened a follow-on project on facilities' own financial responsibility for those drugs (OIG Work Plan). With 10.3% of national Part A days, New York is a large share of that question.
How should a New York operator check its own numbers?
- Count your Part A days for the last 12 months from census, and add Medicare Advantage days where the plan's per diem includes drugs.
- Total facility-paid pharmacy charges for those residents, net of credits.
- Divide to get your cost per facility-responsible day. Our guide to Part A drug cost per patient day has a worked example.
- Compare to the $40 to $48 range as a test, not a target.
- Count Part A days on which the pharmacy billed Part D instead of you. That number is in no public file. It is in your invoices.
- Check fees and credits against your pharmacy services agreement.
Free · 48 hours · no integration
Get a free 48-hour pharmacy audit
- Send three files: invoices, census, contract
- See overbilling and Part A exposure, line by line
- BAA signed before any data moves
Frequently asked questions
How many nursing homes are in New York?
The CMS October 2026 release lists 592 New York nursing homes with 111,253 certified beds. The median building has 160 beds and average occupancy is 88.9%.
How much do New York nursing homes spend on Part A drugs?
No public dataset reports it. Our estimate, using 4.61 million Original Medicare Part A days in fiscal year 2024 and $40 to $48 a day, is $184M to $221M a year statewide. That is a Pennywell estimate, not a measured figure.
What share of New York nursing home days are Medicare?
On 2023 cost reports, Medicare was 13.8% of New York resident-days, Medicaid 63.7% and other payers 22.5%. Other includes Medicare Advantage and private pay.
Does the estimate include Medicare Advantage?
No. CMS does not publish Medicare Advantage SNF days by facility. Where an Advantage plan's per diem includes drugs, the facility carries that drug cost too, so the true figure is likely higher.
Get the 48-hour first look
Public data shows the size of the exposure. Your invoices show where it is. Send three months of pharmacy invoices, your census and your pharmacy services agreement, and within 48 hours we show what the bill gets wrong. Start with the free 48-hour audit or the savings calculator.